D3.js
d3js.orgWhat can D3 do?
Stacked bar chart
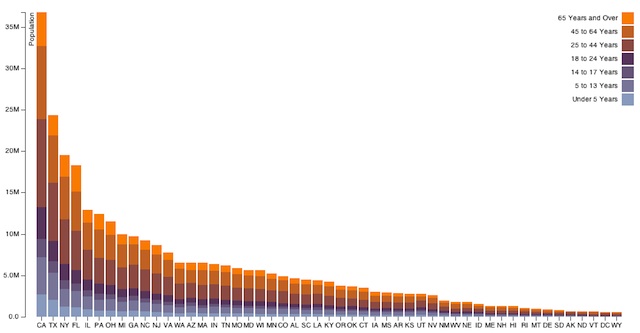
CSV data bound to SVG elements
Pie chart
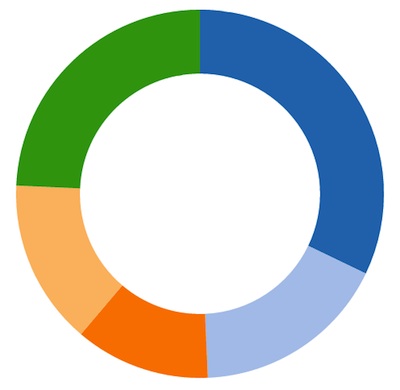
Layouts, transitions
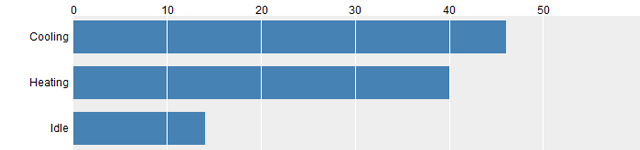
Custom charting
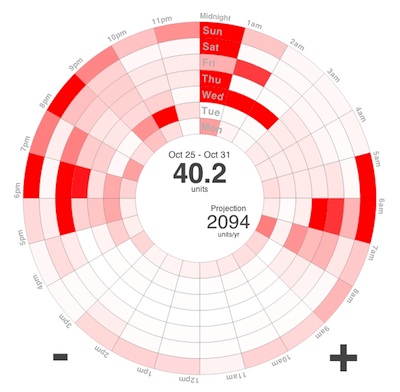
Energy data bound to SVG elements, events
World map
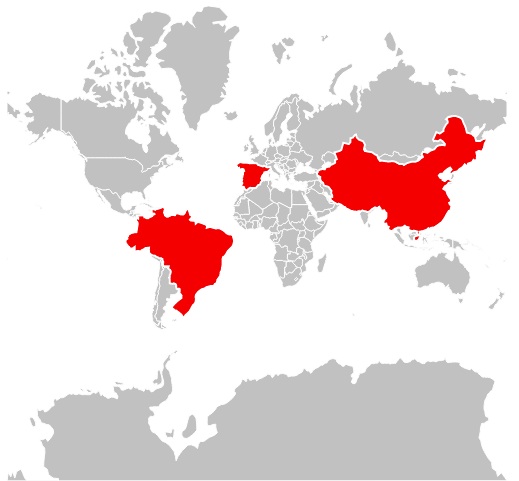
GeoJSON, projection, events
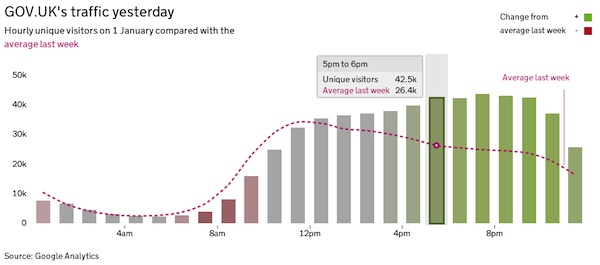
GOV.UK analytics
New York Times
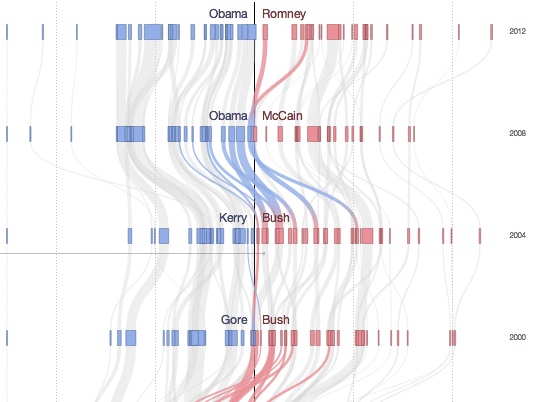
SVG, paths, interaction
what is D3?
- JavaScript library for manipulating documents based on data.
- Allows efficient combination browser capabilities with data.
SVG has many additional Graphical capabilities
- Paths
- Basic Shapes
- Text
- Painting: Filling, Stroking and Marker Symbols
- Gradients and Patterns
- Clipping, Masking and Compositing
- Filter Effects
SVG Shapes
www.w3.org/TR/SVG/shapes.htmlrect
circle
ellipse
line
polyline
polygon
Why D3?
Other libraries
'Data-Driven Documents'
- Bind data to DOM elements
- Create/remove/transform DOM elements
- <p>, <td>, <rect>, <line>, <path> etc.
Why use the DOM?
- Styling (CSS)
- Interaction (events)
- Flexibility (anything that can be represented using HTML, CSS & SVG can be made with D3)
- Debugging (Chrome Developer Tools, Firebug)
- Familiarity (most web developers familiar with the DOM)
Reasons not to choose D3
- Learning curve.
See other libraries built on d3 - Requires SVG for non-trivial graphical visualisations
Browser support
- Modern browsers
- D3 is tested against Firefox, Chrome (Chromium), Safari (WebKit), Opera and IE9
Architecture of D3
Modules
- Core (selections, transitions, requests etc.)
- Scales (map input to output)
- SVG (generate SVG)
- Time (time formatting, math)
- Layouts (chord, cluster, force, hierarchy etc.)
- Geography (geography, projections)
- Geometry (Voronoi, quadtree, polygon, hull)
- Behaviour (drag, zoom)
Core - selections
Similar to, but not the same as, jQuery
/* jQuery */
$('td'); //Returns array (wrapped set) of elements

/* D3 */
d3.select('table'); //Returns array of arrays [[<table>]]
d3.selectAll('td'); //[[<td>, <td>, <td>, <td>]]
d3.selectAll('tr').selectAll('td'); //[[<td>, <td>], [<td>, <td>]]

d3.selectAll('td').text('Some data');
Core - selections
Data binding
/* Data */
var d = [6, 1, 4, 2, 5];

/* Selection */
var selection = d3.selectAll('li');

/* Bind data to elements */
var updateSelection = selection.data(d);
updateSelection[0][0].__data__; // 6
updateSelection.text(function(d) {return d;});
Core - other
/* Transitions */
d3.select('p').transition().style('font-size', '40px')

/* Arrays */
a = [4, 1, 2, 6, 10]
d3.extent(a) //returns [1, 10]
d3.permute(['a', 'b', 'c'], [1, 2, 0]) //returns ['b', 'c', 'a']

/* Requests - similar to jQuery.get() etc. */

/* Formatting */
var zero = d3.format("04d")
zero(2) // returns '0002'

/* Colours */
var red = d3.rgb('red')
red.r // 255
red.g // 0
var darkerRed = red.darker()
darker.r // 178
d3.select('p').style('color', darkerRed)
Scales
Scales are functions that map from an input domain to an output range
var s = d3.scale.linear().domain([0, 1]).range([-10, 10])
s(0) // -10
s(0.5) // 0

var cs = d3.scale.linear().domain([0, 1]).range(['white', 'red'])
cs(0) // '#ffffff'
cs(1) // '#ff0000'
SVG
Add SVG elements like any other element
d3.select('svg').append('circle')
    .attr('cx', 40).attr('cy', 40).attr('r', 40)
    .style('fill', 'red');
...or use an SVG generator to generate path data
/* Create SVG path data generator */
var line = d3.svg.line()
    .x(function(d) { return d.x; })
    .y(function(d) { return d.y; });

/* Data */
var d = [{x: 10, y:10}, {x:20, y:30}, {x:30, y:20}];

/* Generate path data */
line(d); // "M10,10L20,30L30,20"
line.interpolate('basis');
pathData = line(d); // "M10,10C10,10,10,10,11.666,13.333C13.333..."

/* Add to the DOM */
d3.select('svg').append('path').attr('d', pathData);

//Other generators include arc, symbol, chord, diagonal
SVG ctd.
- Axes (for generating axes in SVG)
- Controls (for drawing selection areas)
Time
/* Time scales */
first = new Date('1 Jan 2013');
last = new Date('31 Dec 2013');

var ts = d3.time.scale().domain([first, last]).range([0,1]);

ts(new Date('10 Jan 2013')); // 0.0247

/* Time intervals */
d3.time.week(new Date('4 Jan 2013')); // Sun Dec 30 2012 00:00:00

/* Counting */
d3.time.dayOfYear('10 Jan 2013'); // 9
Layouts
Geography
Maps geographic data (GeoJSON) to SVG path data
Many, many different projections
(Mercator, Albers, Gringorten... many more)
Geometry
- Voronoi tesselation
- Quadtree
- Hull
- Polygon
Behaviors
- Drag
- Zoom
Libraries based on D3
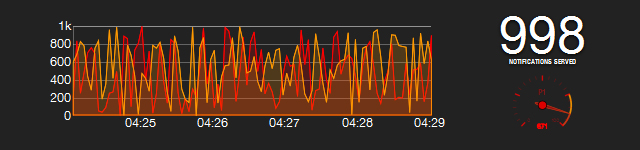
Cubism.js
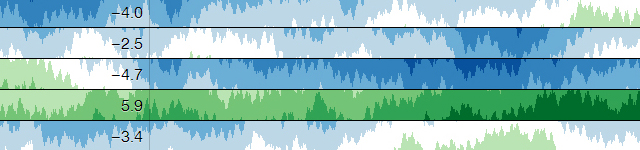
Cubism.js is a D3 plugin used to construct time series charts by pulling data from Graphite, Cube and other sources.
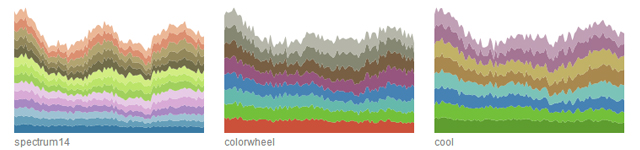
NVD3

NVD3 is a collection of charts and chart components built using D3. The library can be highly customized and produces simple, beautiful, and in many cases fully responsive data visualizations.
DVL
DVL is a free, functionally reactive chart library built on D3. Check out several examples HERE.
Graphene
Graphene is a free dashboard toolkit built on a combination of D3 and Backbone.js.
Rickshaw
Rickshaw is another D3-based charting library that contains a variety of standard chart types. Rickshaw is also free and open source, available under the MIT license.
Polychart
Polychart is a robust charting library with a minimalist visual output. These charts are only free for non-commercial use, but also include support for paid licenses.